March 27, 2023
Timothy Aylor
Senior Economist
Economic Information & Analytics Division
LMI@virginiaworks.gov
(804) 786-3976
Virginia Job Layoffs and Discharges Rise By 9,000 in January
~ Latest BLS Jobs Openings and Labor Turnover Survey Shows a Reduction in Job Quitting Compared to January 2022 ~
RICHMOND— The Virginia Employment Commission announced today that the U.S. Bureau of Labor Statistics’ January 2023 Job Openings and Labor Turnover Survey (JOLTS) reports the rate of job quitting the lowest since early 2021.
According to the most recent BLS JOLTS survey data, the Great Resignation lessened as job quits were down in January compared to recent months. BLS JOLTS data provides information on all the pieces that go into the net change in the number of jobs. These components include job openings, hires, layoffs, voluntary quits, and other job separations (which includes retirements and worker deaths). Putting those components together reveals the overall change in payroll employment. JOLTS data is seasonally adjusted and describes conditions on the last business day of the month. Current month’s data are preliminary and the prior month’s data have been revised.
The number of January 2023 job openings in Virginia fell from December’s revised 344,000 level to 333,000. On the last business day of January, the number of U.S. job openings decreased to 10.8 million (-410,000). In January, the largest decreases in job openings nationwide were in construction (-240,000), accommodation and food services (-204,000), and finance and insurance (-100,000). The largest decreases in the job openings level occurred in California (-163,000), Texas (-98,000), and Michigan (-78,000). The largest increases occurred in Florida (+59,000), Georgia (+48,000), and New Hampshire (+5,000). The Virginia job openings rate (job openings as a percentage of payroll employment) fell by 0.2 percentage points to 7.5 percent from December’s 7.7 percent rate. The U.S. rate decreased to 6.5%. The largest decreases in job openings rates occurred in North Dakota (-1.8 percentage points), Iowa (-1.7 points), and Michigan (-1.6 points). The increases occurred in Georgia and South Dakota (+0.8 point each), as well as in Florida (+0.5 point).
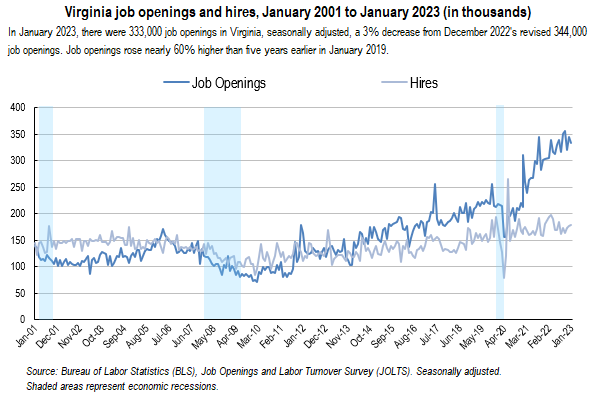
The number of hires in Virginia was little changed at 178,000 in January, up a thousand over the month but up by over five percent year over year. JOLTS defines hires as all additions to the payroll during the month. The series low of 79,000 was set in April 2020, while the high of 266,000 was set in June of that year. In January, the number of hires nationwide changed little at 6.4 million.
Hires changed little in all industries. The largest increases in the hires level occurred in California (+87,000), Pennsylvania (+38,000), and Ohio (+35,000). In Virginia, the hires rate was unchanged from December’s revised 4.3 percent rate. The national hires rate of 4.1% was little changed over the month. The largest increases in hires rates occurred in Arizona and South Dakota (+0.8 percentage point each).
In January 2023, the Virginia ‘annual fill’ rate (the ratio of ‘this month’ hires to ’last month’ job openings, over the year) rose to the historical, typical level of 1.0, matching the annual fill rate nationwide. This indicates a trend in recent months towards less difficulty in filling positions when compared to a year earlier. The fill rate is a measure used to evaluate how labor markets differ in the pace that job openings are filled. An annual fill rate near or above 1.0 can indicate that employers are growing more efficient at filling job openings. On the other hand, an annual fill rate of less than 1.0 can indicate a tighter labor market, with employers having greater difficulty filling job openings compared to a year earlier. Going back to 2001, the highest annual fill rate occurred during June 2020 because, after the nationwide shutdown due to the COVID-19 pandemic, employers across the country sought to quickly hire for vacated positions. The lowest fill rate in Virginia occurred in June 2021. During that time, there were many factors that hindered the filling of vacant positions by employers, such as health concerns, employee skills, and childcare needs, but the biggest factor was the comparison against the historic re-hiring hike the year before.
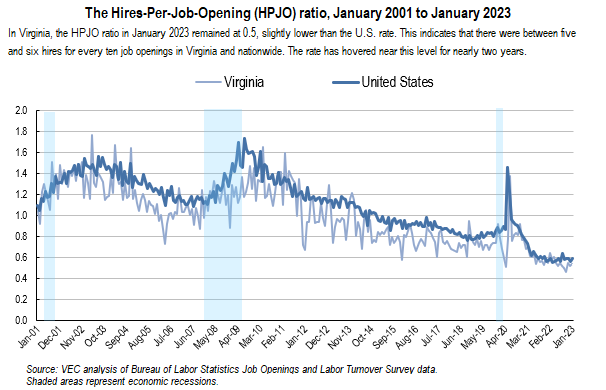
The hires-per-job-openings (HPJO) ratio remained at December’s revised 0.5 rate, a little lower than the rate nationwide. This measure shows the rate of hiring compared to open jobs and is a proxy for time to fill positions. During the last twelve months, the rate hovered around six hires for every ten job openings across the U.S.
In January, the number of total separations in Virginia decreased by 5,000 to 148,000. This was a decline of nearly nine percent over the year, and a decrease of 4.5 percent compared to five years earlier in 2019. In January, the number of total separations in the U.S. changed little at 5.9 million. The number of total separations decreased in federal government (-13,000). The largest increases in the total separations level occurred in Georgia (+36,000), North Carolina (+34,000), and Minnesota (+21,000). The largest decreases occurred in Indiana (-17,000), Iowa (-12,000), and Utah (-11,000). The Virginia total separations rate was little changed, edging down to 3.6 percent from December’s 3.7 percent rate. Over the month, the U.S. rate was unchanged at 3.8 percent. The increases in total separations rates occurred in Alaska (+1.1 percentage points) and Georgia (+0.8 point), as well as in Minnesota and North Carolina (+0.7 point each).
An estimated 96,000 workers quit jobs from Virginia employers in January. The number of quits fell by 13,000 from December’s revised figure of 109,000 and was down by 30 percent from the record breaking high in December 2021. However, it was up by 25 percent compared to before the Pandemic in January 2019. Quits, a component of total separations, are voluntary separations initiated by the employee. They can be seen as a leading indicator of wage trends in that it includes workers who quit to move to another job. In January, the number of U.S. quits decreased to 3.9 million (-207,000). Quits decreased in professional and business services (-221,000), educational services (-14,000), and federal government (-5,000). In January, the largest decreases in the quits level occurred in Texas (-47,000), Florida (-25,000), and Utah (-13,000). The increase occurred in Maryland (+13,000). The quits rate in the Commonwealth decreased by 0.4 of a percentage point to 2.3 percent but remained at the elevated levels seen over the last twelve months. Over the month, the national quits rate edged down to 2.5 percent, with establishments with 1 to 9 employees seeing a decrease in the rate of quitting. The largest decreases in quits rates occurred in Idaho and Utah (-0.9 percentage point each) and in Wyoming (-0.7 point). The increase occurred in Maryland (+0.5 point).
The number of layoffs and discharges in Virginia increased by 9,000 to 44,000 in January 2023 from December’s revised 35,000 figure. This was 26 percent growth over the year and 29 percent compared to five years before in 2019. Layoffs and discharges are countercyclical, which means that layoffs typically increase during economic contractions and decrease during economic expansions. In January, the number of U.S. layoffs and discharges increased to 1.7 million (+241,000). The rate was little changed at 1.1 percent. Layoffs and discharges increased in professional and business services (+190,000) but decreased in federal government (-5,000). The number of layoffs and discharges increased in 10 states, decreased in 2 states, and was little changed in 38 states and the District of Columbia in January. The largest increases in the layoffs and discharges levels occurred in Florida (+58,000), North Carolina (+34,000), and Texas (+33,000). The decreases occurred in Indiana and Missouri (-10,000 each).
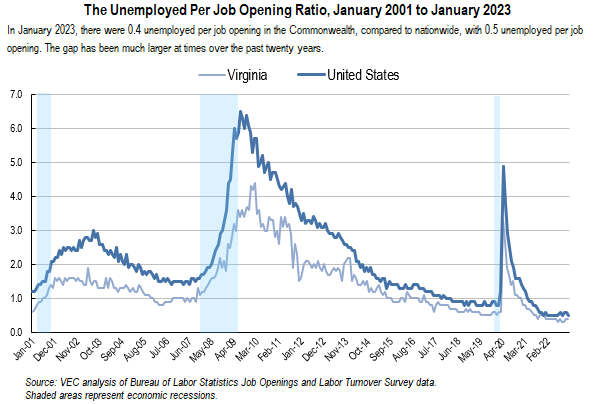
In January 2023, there was less than one unemployed worker per two job openings in the Commonwealth, as had been the case for the previous twelve months. This period marked the lowest rates since January 2001, when BLS began collecting the data. In Virginia, the unemployed per job opening ratio (sometimes called the ‘job seekers ratio’) was 0.4 in January but peaked at 4.4 unemployed per job opening in February 2010 during the Great Recession. The number of unemployed workers per job opening stood at 3.3 in April 2020 during the height of pandemic employment impacts. Across the U.S., there was a ratio of unemployed people to job openings of 0.5 for January, unchanged over the month. The ratio of unemployed people per job opening has been below 1.0 since July 2021. The number of unemployed people per job opening nationwide reached its highest level of 6.5 in July of 2009, at the height of the Great Recession.
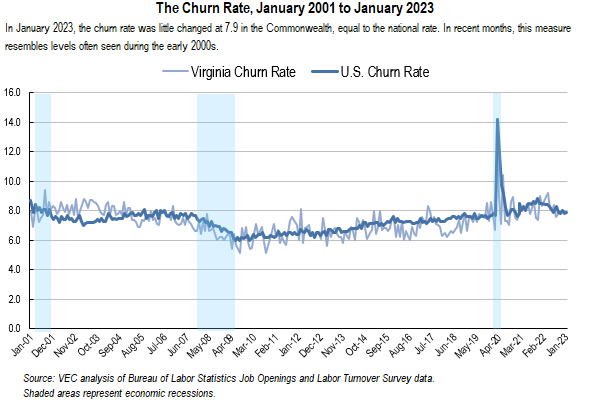
The January 2023 churn rate (the sum of the hires rate and the total separations rate) was little changed from December’s revised 8.0 rate in Virginia, indicating continued elevated velocity of movement into and out of jobs, though a little slower than in much of 2022. Nationwide performed similarly, as the U.S. churn rate was little changed over the month but signaled some deceleration over the year. An elevated churn rate indicates a labor market with a high hires rate, a high separations rate, or both. It can signify that workers are moving more frequently into and out of jobs in the labor market. Conversely, a low churn rate indicates a labor market with a low hires rate, a low separations rate, or both. Labor markets with the most churn may also have more seasonal employment patterns not fully captured by seasonal adjustment factors, which can lead to more frequent job-to-job movement.
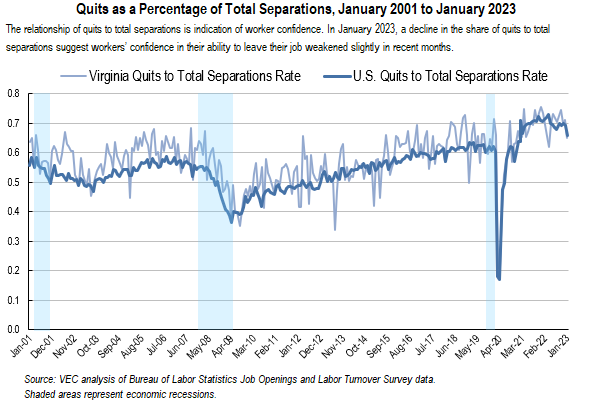
On the last business day of January 2023, the number and rate of job quits in Virginia decreased while layoffs and discharges rose by 30 percent from January 2022. As a result, job quits as a percentage of total separations slowed from a little over 70 percent in 2022 to 65 percent in January 2023. This may be an indication of a slight loosening in recent years’ labor market with quits comprising a smaller portion and layoffs/discharges comprising a larger portion of job separations in the Commonwealth.
###
Revision note: Effective with the January release, the BLS Job Openings and Labor Turnover Survey (JOLTS) estimates have been revised to incorporate the annual updates to the Current Employment Statistics employment data and the JOLTS seasonal adjustment factors. Not seasonally adjusted data and seasonally adjusted data from January 2018 forward were subject to revision. Additional information about these changes is available at www.bls.gov/jlt/jolts-2023-changes.htm.
The Virginia Employment Commission plans to release the February 2023 analysis of the BLS Job Openings and Labor Turnover Survey for Virginia on Monday, April 24, 2023. The data for all states and the U.S. will be available on the BLS website JOLTS page, at https://www.bls.gov/jlt/. BLS is scheduled to release the February JOLTS data for states on Wednesday, April 19, 2023.
Technical note: The Bureau of Labor Statistics (BLS) Job Openings and Labor Turnover Survey (JOLTS) produces monthly data on U.S. and regional job openings, hires, quits, layoffs and discharges, and other separations from a sample of approximately 21,000 establishments. As a supplement, BLS has begun publishing state estimates that provide monthly information that can be used to better understand the dynamic activity of businesses in state economies that leads to aggregate employment changes. For more information on the program’s concepts and methodology, see “Job Openings and Labor Turnover Survey: Handbook of Methods” (Washington, DC: U.S. Bureau of Labor Statistics, July 13, 2020), https://www.bls.gov/opub/hom/jlt/home.htm. For more information on BLS’ state JOLTS estimates, see https://www.bls.gov/jlt/jlt_statedata.htm.
Definitions of JOLTS terms*
Job Openings
Job openings include all positions that are open on the last business day of the reference month. A job is open only if it meets the following three conditions: (1) A specific position exists and there is work available for that position; the position can be full time or part time, and it can be permanent, short term, or seasonal; (2) the job could start within 30 days, whether or not the employer can find a suitable candidate during that time; and (3) the employer is actively recruiting workers from outside the establishment to fill the position. Excluded are positions open only to internal transfers, promotions or demotions, or recalls from layoffs.
Hires
Hires include all additions to the payroll during the entire reference month, including newly hired and rehired employees; full-time and part-time employees; permanent, short-term, and seasonal employees; employees who were recalled to a job at the location following a layoff (formal suspension from pay status) lasting more than 7 days; on-call or intermittent employees who returned to work after having been formally separated; workers who were hired and separated during the month; and transfers from other locations. Excluded are transfers or promotions within the reporting location, employees returning from a strike, and employees of temporary help agencies, employee leasing companies, outside contractors, or consultants.
Separations
Separations include all separations from the payroll during the entire reference month and are reported by type of separation: quits, layoffs and discharges, and other separations. Quits include employees who left voluntarily, except for retirements or transfers to other locations. Layoffs and discharges include involuntary separations initiated by the employer, including layoffs with no intent to rehire; layoffs (formal suspensions from pay status) lasting or expected to last more than 7 days; discharges resulting from mergers, downsizing, or closings; firings or other discharges for cause; terminations of permanent or short-term employees; and terminations of seasonal employees (whether or not they are expected to return the next season). Other separations include retirements, transfers to other locations, separations due to employee disability, and deaths. Excluded are transfers within the same location, employees on strike, and employees of temporary help agencies, employee leasing companies, outside contractors, or consultants.
*Excerpted from U.S. Bureau of Labor Statistics, Handbook of Methods, "Job Openings and Labor Turnover Survey: Concepts," https://www.bls.gov/opub/hom/jlt/concepts.htm.